Lifetime regressions#
A built-in dataset of insulator string lifetimes and covariates.
[1]:
from relife.data import load_insulator_string

data = load_insulator_string()
print(data.dtype.names)
('time', 'event', 'entry', 'pHCl', 'pH2SO4', 'HNO3')
[2]:
print(data["pHCl"])
[0.49 0.76 0.43 ... 1.12 1.19 0.35]
Covariates must be grouped in one np.ndarray.
[3]:
import numpy as np

covar = np.column_stack((data["pHCl"], data["pH2SO4"], data["HNO3"]))
print(covar.shape)
(12000, 3)
[4]:
from relife.lifetime_model import ProportionalHazard, Gompertz
[5]:
regression = ProportionalHazard(Gompertz())
regression.fit(data["time"], covar, event=data["event"], entry=data["entry"])
[5]:
<relife.lifetime_model._regression.ProportionalHazard at 0x7618ebdf3e90>
[6]:
print(regression.params, regression.params_names)
[ 4.11139839 -2.67864095 3.24298564 0.22415155 0.02944536] ('coef_1', 'coef_2', 'coef_3', 'shape', 'rate')
Notice that the regression parameters include parameters from the baseline (Gompertz) and the covariate effect.
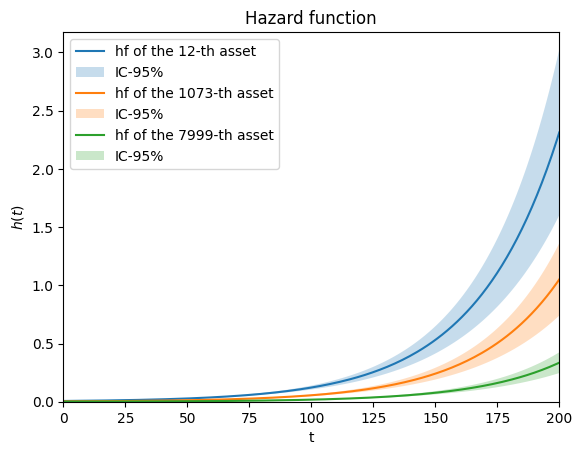
[7]:
import matplotlib.pyplot as plt

i, j, k = 12, 1073, 7999

regression.plot.hf(covar[i], end_time=200, label=f"hf of the {i}-th asset")
regression.plot.hf(covar[j], end_time=200, label=f"hf of the {j}-th asset")
regression.plot.hf(covar[k], end_time=200, label=f"hf of the {k}-th asset")
plt.show()