Lifetime distributions#
A built-in dataset of circuit breaker lifetimes.
[1]:
from relife.data import load_circuit_breaker

data = load_circuit_breaker()
print(data["time"])
print(data["event"])
print(data["entry"])
[34. 28. 12. ... 42. 42. 37.]
[ True  True  True ... False False False]
[33. 27. 11. ... 31. 31. 26.]
[2]:
from relife.lifetime_model import Weibull, Gompertz
[3]:
weibull = Weibull()
gompertz = Gompertz()
From now, the models parameters are unknown, thus set to np.nan.
[4]:
print(weibull.params_names)
print(weibull.params)
('shape', 'rate')
[nan nan]
[5]:
weibull.fit(data["time"], event=data["event"], entry=data["entry"])
gompertz.fit(data["time"], event=data["event"], entry=data["entry"])
[5]:
<relife.lifetime_model._distribution.Gompertz at 0x727aa2e01510>
[6]:
print(weibull.params_names, weibull.params)
print(gompertz.params_names, gompertz.params)
('shape', 'rate') [3.7267452  0.01232326]
('shape', 'rate') [0.00390781 0.07579546]
After fitting, parameters are setted inplace.
[7]:
print(weibull.fitting_results)
print(gompertz.fitting_results)
fitted params : [3.72675, 0.0123233]
AIC           : 2493.72
AICc          : 2493.72
BIC           : 2506.41
fitted params : [0.00390781, 0.0757955]
AIC           : 2485.57
AICc          : 2485.57
BIC           : 2498.25
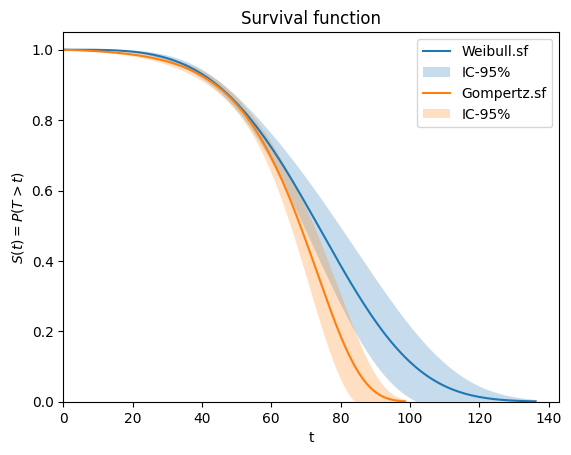
To plot the survival function, do the following.
[8]:
import matplotlib.pyplot as plt

weibull.plot.sf()
gompertz.plot.sf()
plt.show()