Lifetime regressions#
A built-in dataset of insulator string lifetimes and covariates.
[1]:
from relife.datasets import load_insulator_string

dataset = load_insulator_string()
print(dataset.dtype.names)
('time', 'event', 'entry', 'pHCl', 'pH2SO4', 'HNO3')
[2]:
print(dataset["pHCl"])
[0.49 0.76 0.43 ... 1.12 1.19 0.35]
Covariates must be grouped in one np.ndarray.
[3]:
import numpy as np

covar = np.column_stack((dataset["pHCl"], dataset["pH2SO4"], dataset["HNO3"]))
print(covar.shape)
(12000, 3)
[4]:
from relife.lifetime_models import ParametricProportionalHazard, Gompertz
[5]:
regression = ParametricProportionalHazard(Gompertz())
regression.fit(
    dataset["time"],
    covar,
    event=dataset["event"],
    entry=dataset["entry"]
)
[5]:
<relife.lifetime_models._parametric_regressions.ParametricProportionalHazard at 0x78aded70d190>
[6]:
print(regression.get_params(), regression.get_params_names())
[ 4.10887984 -2.66050611 3.23411769 0.21810962 0.02945802] ('coef_1', 'coef_2', 'coef_3', 'shape', 'rate')
Notice that the regression parameters include parameters from the baseline (Gompertz) and the covariate effect.
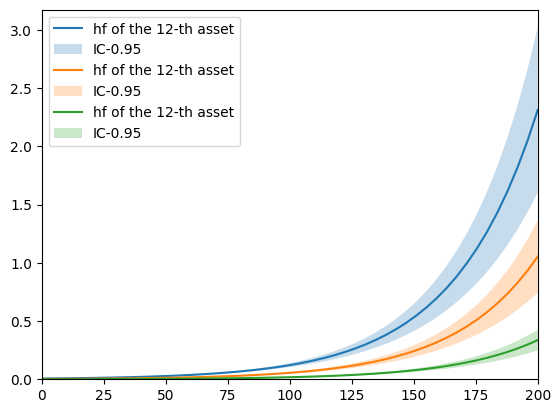
[7]:
import matplotlib.pyplot as plt

i, j, k = 12, 1073, 7999

timeline = np.linspace(0, 200)
regression.plot("hf", timeline, covar[i], label=f"hf of the {i}-th asset")
regression.plot("hf", timeline, covar[j], label=f"hf of the {i}-th asset")
regression.plot("hf", timeline, covar[k], label=f"hf of the {i}-th asset")
plt.show()